
In sports, injuries are a given. In collecting, they’re a market event.
Collectors often ask: “Should I sell now?” or “Is this the dip to buy?” when a star player hits the injured list. But instead of guessing, I wanted to bring data to the conversation.
As part of a broader consulting project with a company in the trading card space, I built a model to measure how injuries affect secondary market prices. The goal wasn’t just to confirm assumptions but to quantify them.
And what I found was fascinating: Injuries generally hurt card sales… unless they don’t.
Let’s break it down.
The Dataset: Building the Right Sample
To begin, I curated a list from a “500 Can’t-Miss Cards” watchlist and narrowed it down to active MLB players only. Retired players were excluded because sales data for them thins out quickly, especially pre-2020. The intent was to track how today’s collectors behave not to analyze vintage market patterns.
From there:
- I pulled injury timelines from FOX Sports and other news outlets
- Focused only on injuries that caused players to miss games
- Scraped sales volume data from CardLadder for each player
- Looked at 30 days before and after each documented injury
The result was a clean, structured view of how the card market reacts in real time to player injuries.
The Methodology: Two Statistical Tools
To explore the impact from both a macro and micro perspective, I used two analytical approaches:

Paired T-Test
This method compares two related samples in this case, a player’s card sales before and after an injury.
It answers the question:
“Do post-injury card sales significantly differ from pre-injury sales for the same player?”
Why it works: It isolates the injury as the primary variable and tests if the observed change is statistically significant or just noise.

Linear Regression
While the t-test tells us if something happened, regression helps explain why.
Specifically, I used a simple linear regression model to test if the number of prior injuries a player had over the past three years affected how their cards performed after the most recent injury.
This let me quantify:
- The baseline impact of injury (the intercept)
- The marginal impact of each prior injury (the slope


Headline Insight: Injuries Hurt Sales: Period
The t-test results were crystal clear.
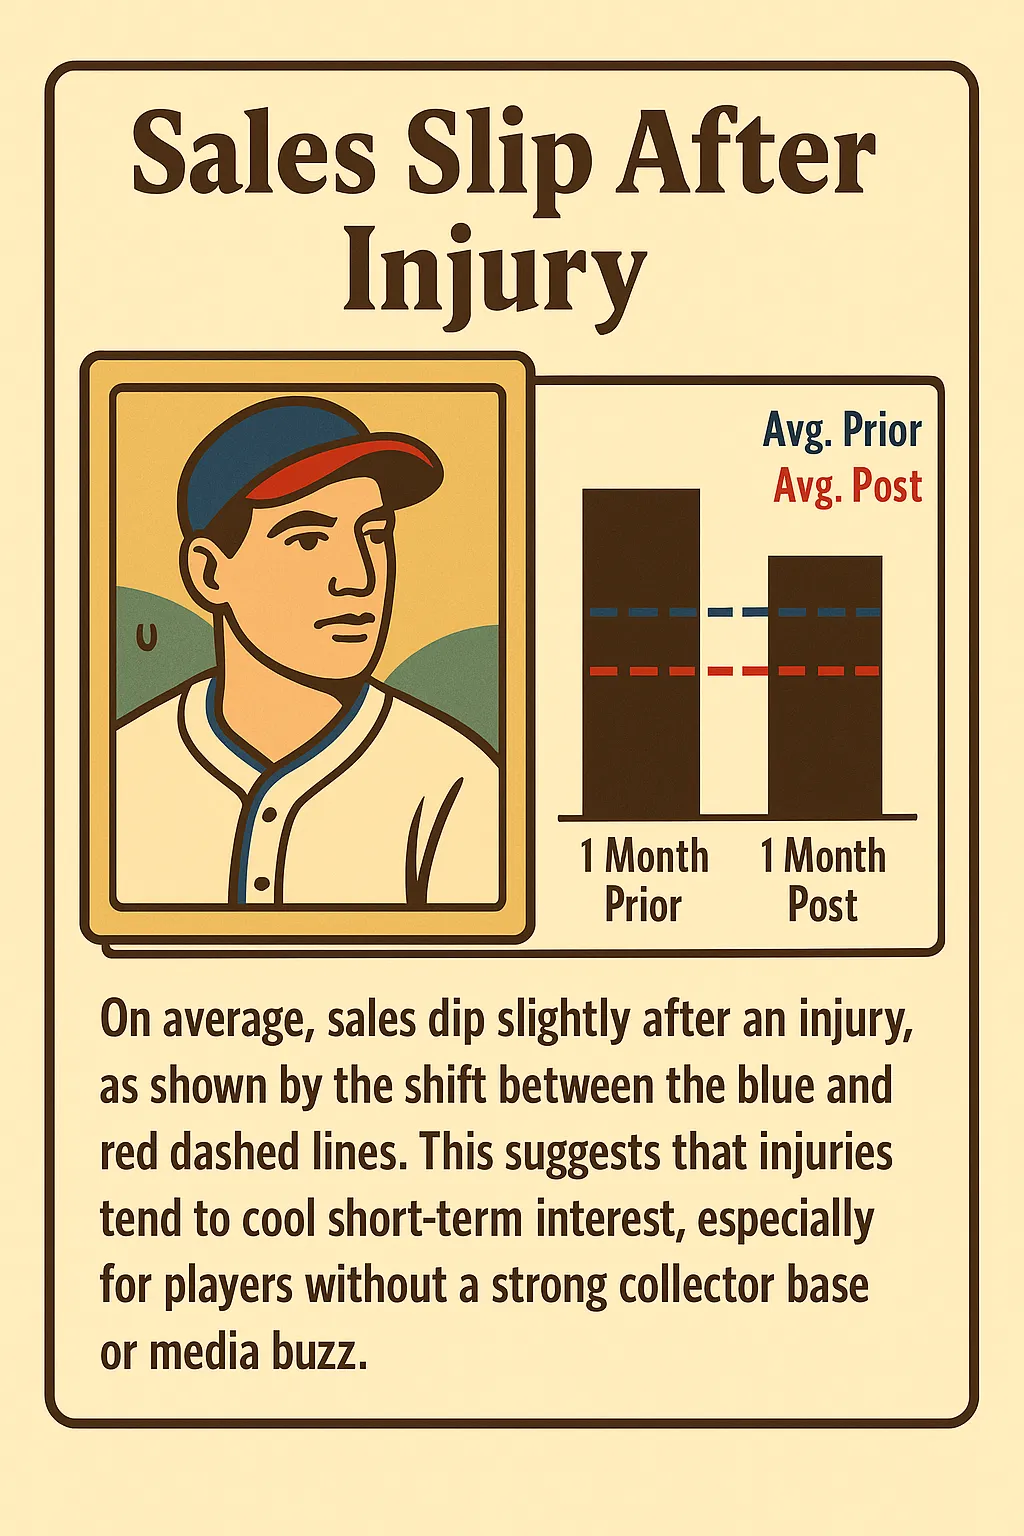
On average, card sales dropped by $3,820 in the month after an injury.
That’s a 17% decrease, and it was statistically significant (p = 0.0299).
Collectors, it seems, are quick to hit pause on players who get hurt. Unless there’s buzz or a loyal following, injuries tend to cool momentum.


Here’s what the data showed:
- Players without strong collector bases saw steep drop-offs.
- Even stars saw a decline if the injury timing aligned with a cold season or market downturn.
- The dip wasn’t always dramatic, but the signal was consistent.
This reinforces the market’s short-term risk aversion: buyers hesitate when durability is in question.
But the Twist: Injury History Can Boost Sales
This is where it gets interesting.
Using regression, I modeled the number of prior injuries (within 3 years) as a predictor of post-injury sales behavior.

The result?
Each prior injury correlated with a +7.4% increase in post-injury card sales.
The result was highly significant (p < 0.001) with a 95% confidence interval ranging from 3.6% to 11.1%.
In plain English: the more banged up a player is, the better their cards may perform after the next injury.

Why?
A few theories:
- Media magnetism: Stars like Fernando Tatis Jr. or Jacob deGrom generate headlines with each return or setback.
- Collector speculation: Injuries trigger buying opportunities flippers hope for a rebound.
- Scarcity narratives: Fans worry about retirement or reduced card production, and buy in while they still can.
- Survivor bias: The players who keep bouncing back tend to have loyal fanbases, which props up sales.
This runs counter to the surface-level reaction and shows that not all injuries are priced equally.
Visualizing the Trend
When graphed, the data shows a modest downward curve in general sales after injury but with high-variance outliers where post-injury sales spiked.


Those spikes? They often came from:
- Big-name players with a track record of injuries
- Social media buzz around a dramatic play or rehab update
- Speculative buyers seeing a “buy low” opportunity
It’s a nuanced picture: yes, injuries suppress sales. But they also create flashpoints of interest.
Key Takeaways
Those spikes? They often came from:
- Big-name players with a track record of injuries
- Social media buzz around a dramatic play or rehab update
- Speculative buyers seeing a “buy low” opportunity
It’s a nuanced picture: yes, injuries suppress sales. But they also create flashpoints of interest.

Applying the Insights
These aren’t just data points they can drive strategy for marketplaces, investors, and pricing engines.
1.) Injury Sentiment Modifier
Adjust pricing models in real-time:
- Apply a temporary 5–10% price reduction for isolated injuries
- Mitigate that adjustment for high-profile players with prior injuries
2.) Model Injury Variables
Train pricing algorithms to recognize injury impact:
- Flags for “recent injury” (last 30 days)
- Count of prior injuries
- Days since last injury
- Position-based risk (e.g., pitchers vs. outfielders)
3.) Trigger “Buy the Dip” Nudges
Marketplaces could label these cards with:
“Card dropped 12% after injury historically, these rebound. Buy the dip?”
This helps collectors identify value plays without needing deep data dives.
4.) Track Injury-Driven Scarcity
Players who are often injured may:
- Retire earlier
- Be featured less in future sets
- Gain sudden relevance due to comebacks
Their volatility creates opportunity. Build watchlists accordingly.
5.) Dashboards for Market Intelligence
An internal dashboard could track:
- Sales patterns pre- and post-injury
- Recovery curves over 1/3/12 months
- Best rebounders and worst cases
Use it for product decisions, pricing updates, and targeted marketing campaigns.
6.) Pricing Shock Forecasting
For high-end investors, add a “risk score” based on:
- Age
- Injury history
- Position-specific risk
Helps with managing downside exposure for portfolio collectors.
Final Word: Don’t Fear the Injury List: Understand It

Injuries shake the market but they don’t always mean doom for card values.
Yes, sales tend to dip. But the deeper truth is this: injuries create narrative. And narrative drives action whether it’s panic selling, speculative buying, or long-term holding.
Collectors are emotional. Markets are reactive. But data shows us where the patterns are and how to get ahead of them.
For anyone building pricing models, running marketplaces, or just collecting smarter: this is a trend worth tracking.
Leave a Reply